About AnyStock Stock and Financial JS Charts
AnyStock Stock and Financial JS Charts is a flexible JavaScript charting library to visualizing large data sets in interactive HTML5 charts. Designed to display date/time information it offers various chart types, drawing...
AnyChart Stock and Financial JS Charts (short: AnyStock) is a JavaScript based financial and stock charting library, also used for visualizing any timeline data over a long time. AnyStock technology turns your real-time data into highly sophisticated charts with interactive features, bringing visualization of your data to the Web and providing a full feature set for creating real-time streaming and data manipulation applications.
Designed to display date and time based information, AnyStock is the ideal tool for client reporting and performance reporting applications. Reports and Dashboards are visualized with scrolling, drill downs, panning and zoom functionality available in all of our HTML5 charts. AnyStock brings analysis of your FOREX, commodity and investment market data to life. The ability to review long term and large data sets can easily be handled with scroll, pan, and zoom controls.
AnyStock is fully integrated into AnyChart 7 Framework and shares most of its ideology, settings technique and ease of use - and you can use AnyStock along other charts including those available in the AnyChart JavaScript Charts, AnyGantt JavaScript Gantt Charts, and AnyMap JavaScript Maps.
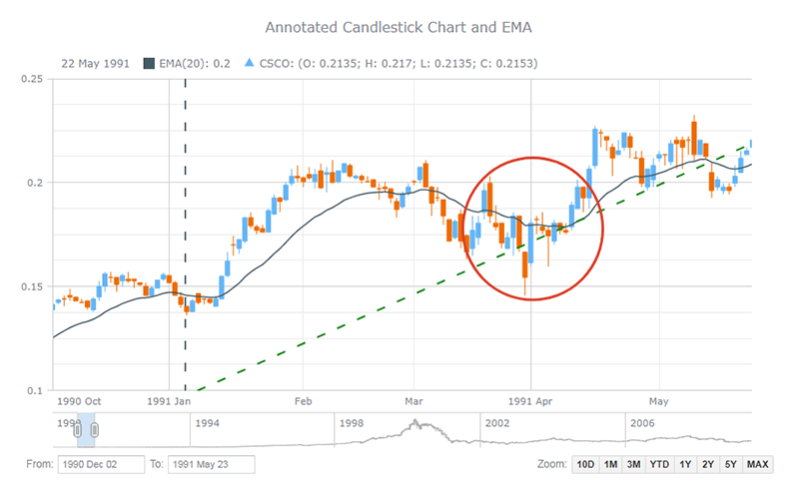
AnyStock supports a wide range of stock chart types (including Candlestick, OHLC, Line, Spline, Column, Step Line, Area, Step Area, Spline Area, Marker, Range Column, Range Area, Range Spline Area, Stacked Stock JS charts) and technical analysis indicators (MACD, ROC, RSI, SMA, EMA, DMI, CHO, CCI, and others; customs indicators can be set up). Drawing tools (including Line segment, Ray, Trend line, Trend channel, Andrew's pitchfork, Fibonacci fan, Buy/Sell signals, and many others) and adding of news events (analyst opinions, insider trading, dividends, and key developments) to improve the ability to analyze information effectively are also available and have made an important contribution to the superfast HTML5 visualization of stock/financial or any timeline data w/ AnyStock JS.
Previous Versions
Here you can find the changelog of AnyStock Stock and Financial JS Charts since it was posted on our website on 2016-04-21 15:47:18.
The latest version is 8.7.0 and it was updated on 2024-04-23 08:30:45. See below the changes in each version.
AnyStock Stock and Financial JS Charts version 8.7.0
Updated At: 2019-08-08
Changes: Client-side export - save data visualizations as images (SVG, PNG, and JPG) and PDF documents without a roundtrip to the server. Stock UI Controls: Swap (Up/Down) and Maximize. Stock Plot Splitter. New technical indicators for technical analysis: ENV, IKH, PPO, RCI, and PSY.
AnyStock Stock and Financial JS Charts version 8.6.0
Updated At: 2019-05-14
Changes: DVF-4140 - Sticky Y-crosshair feature added.
DVF-3596 - AnyChart Locales Improved.
DVF-3597 - Custom Messages in locales.
DVF-4051 - Color Scale reworked - default range and “equal†flag are added.
DVF-4073 - Auto localized context menu from the included locale.
Much more.
AnyStock Stock and Financial JS Charts version 8.5.0
Updated At: 2018-12-24
Changes: New feature in JavaScript data visualization library AnyStock v8.5.0: Timescale Minimum and Maximum Gaps - now you can set gaps at the beginning and the end of the timescale. Also: AnyStock tooltips now support single display mode, where tooltip is shown for separate elements of series. And more.
AnyStock Stock and Financial JS Charts version 8.4.2
Updated At: 2018-11-23
Changes: Improvements and bug fixes for JavaScript (HTML5) stock charts data visualization library AnyStock by AnyChart JS Charts, including extra small values issue fix, tooltip format issue fix, and Awesome Oscillator fill coloring issue fix.
AnyStock Stock and Financial JS Charts version 8.2.1
Updated At: 2018-04-16
Changes: New Features:
DVF-3585 - Added the allowPointSettings() method.
Bug fixes:
DVF-3681 - Crosshair issues fixed.
AnyStock Stock and Financial JS Charts version 8.2.0
Updated At: 2018-03-26
Changes: Major news: min/max labels, new technical indicators (Parabolic SAR (PSAR), Money Flow Index (MFI), Momentum, Williams %R), additional touch support, negative logarithmic scale, crosshair multiple labels. Improvements: X scale irregular intervals support, ability to select data range by points count
AnyStock Stock and Financial JS Charts version 8.1.0
Updated At: 2017-12-20
Changes: Label annotations supporting live editing and states, export to JSON, with a wide range of text settings. Event markers are now one of AnyStock's greatest features; it’s a special type of chart markers designed to provide the best experience in showing various events on JavaScript financial charts.
AnyStock Stock and Financial JS Charts version 7.14.0
Updated At: 2017-05-30
Changes: New technical analysis indicators: Accumulation Distribution Line (ADL), Commodity Channel Index (CCI), Chaikin Oscillator (CHO), Chaikin Money Flow (CMF), Directional Movement Index (DMI); now AnyStock has 21 indicators. Stacked Stock chart type. Marquee Select/Zoom. Google Spreadsheets data loader
AnyStock Stock and Financial JS Charts version 7.13.0
Updated At: 2017-02-28
Changes: Opened source code.
Plugins: Angular, React, Ember, Meteor, NodeJS, jQuery.
Technical indicators: AMA, KDJ, BBands, Stochastic...
Customs series drawing.
Step Line Backward/Forward, Stick, Jump Line charts.
Individual point settings.
New legend customization options.
Sharing on social media.
AnyStock Stock and Financial JS Charts version 7.9.0
Updated At: 2016-01-27
Changes: Technical Indicators. AnyStock JavaScript Charts technical indicators allow you to create custom indicators for HTML5 stock charts. Full customization of both visual and mathematical components is available. This release includes 5 predefined technical analysis indicators: MACD, RSI, SMA, EMA, ROC.
Disclaimer
External Download
We do not host AnyStock Stock and Financial JS Charts on our servers. We did not scan it for viruses, adware, spyware or other type of malware. This app is hosted by the software publisher and passed their terms and conditions to be listed there. We recommend caution when installing it.
The external download link for AnyStock Stock and Financial JS Charts is provided to you by apps112.com without any warranties, representations or guarantees of any kind, so access it at your own risk.
If you have questions regarding this particular app contact the publisher directly. For questions about the functionalities of apps112.com contact us.